")
")
Free Access
Figure 1.
Télécharger l'image originale
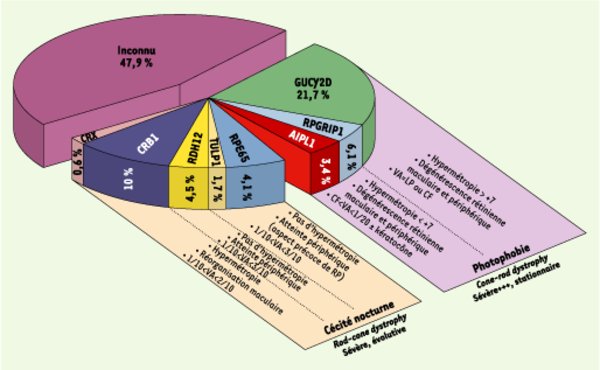
Représentation graphique des corrélations génotype-phénotype établies pour l’amaurose congénitale de Leber et fréquence de l’implication de chaque gène responsable de la maladie.
Current usage metrics show cumulative count of Article Views (full-text article views including HTML views, PDF and ePub downloads, according to the available data) and Abstracts Views on Vision4Press platform.
Data correspond to usage on the plateform after 2015. The current usage metrics is available 48-96 hours after online publication and is updated daily on week days.
Initial download of the metrics may take a while.