")
")
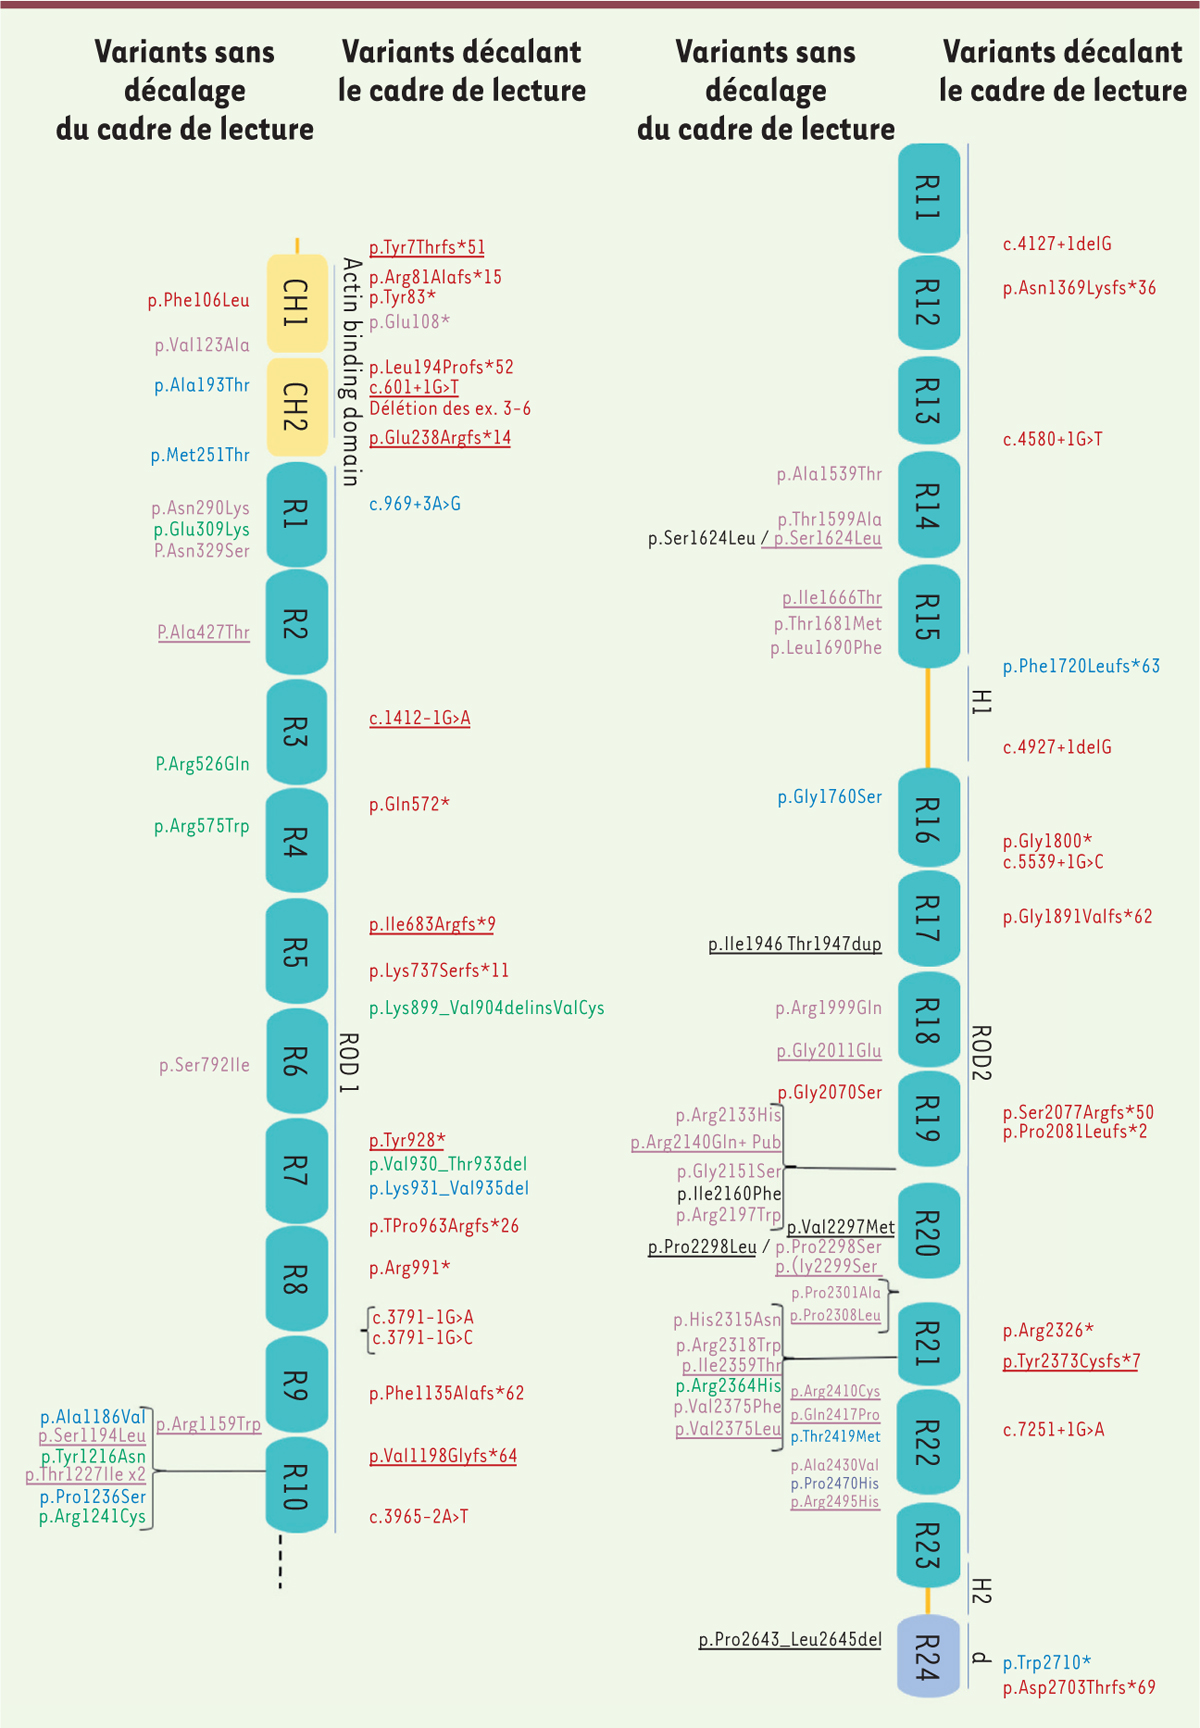
Figure 1.
Télécharger l'image originale
Représentation schématique de la filamine C avec les différents domaines (actin binding, ROD1, Hinge1 [H1], ROD2, domaine de dimérisation [D]). Les régions R10 ET R11 sont contiguës. Les variants publiés (HGMD Pro) et ceux de cette cohorte (soulignés) sont positionnés le long de la protéine, en rouge variant identifié chez un patient atteint de CMD, en fuschia variant identifié chez un patient atteint de CMH, en noir variant identifié chez un patient atteint de CMR, en bleu, variant identifié chez un patient atteint de MD et en vert variant identifié chez un patient atteint de MMF. Les variants tronquants sont représentés sur la partie supérieure de la filamine C et les variants non tronquants sur la partie inférieure.
Current usage metrics show cumulative count of Article Views (full-text article views including HTML views, PDF and ePub downloads, according to the available data) and Abstracts Views on Vision4Press platform.
Data correspond to usage on the plateform after 2015. The current usage metrics is available 48-96 hours after online publication and is updated daily on week days.
Initial download of the metrics may take a while.