")
")
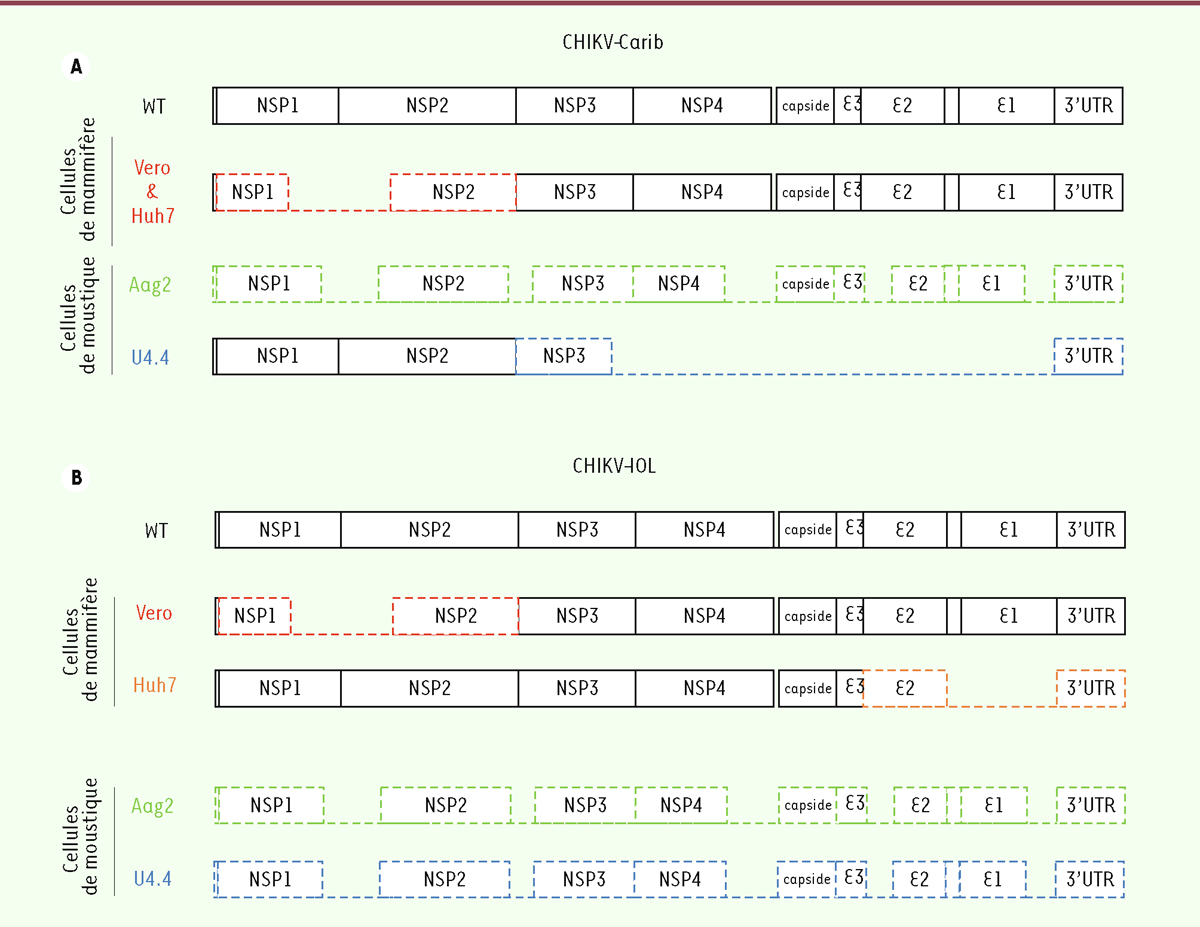
Figure 2.
Télécharger l'image originale
Représentation graphique des génomes viraux défectueux produits in vitro et in vivo et caractérisés par analyse bio-informatique. Schéma des DVG candidats en fonction du type cellulaire (mammifère ou moustique) et de la souche à partir desquels ils ont été purifiés (CHIKV-Carib (A), CHIKV-IOL (B)). Les pointillés représentent les zones de délétion potentielles.
Current usage metrics show cumulative count of Article Views (full-text article views including HTML views, PDF and ePub downloads, according to the available data) and Abstracts Views on Vision4Press platform.
Data correspond to usage on the plateform after 2015. The current usage metrics is available 48-96 hours after online publication and is updated daily on week days.
Initial download of the metrics may take a while.