")
")
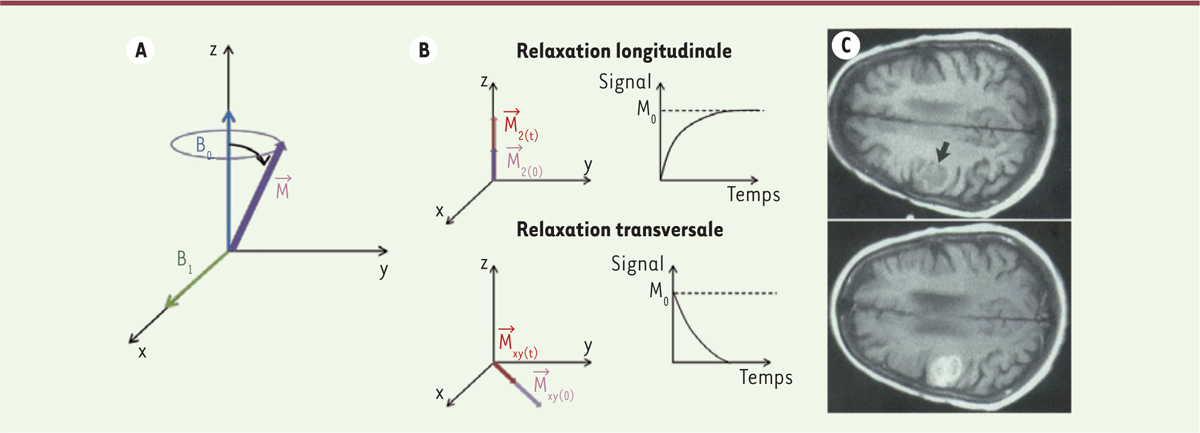
Figure 1.
Télécharger l'image originale
A. Bascule de l’aimantation après application d’un champ magnétique B1. B. Relaxation de l’aimantation selon z : longitudinale, et dans le plan xy : transversale. C. Image pondérée en T1 du cerveau avant (haut) et après administration d’un agent de contraste (Gadoteridol 0,3 mmol Gd/kg). Le contraste augmente dans la tumeur (indiquée par une flèche) après injection (d’après [1]).
Current usage metrics show cumulative count of Article Views (full-text article views including HTML views, PDF and ePub downloads, according to the available data) and Abstracts Views on Vision4Press platform.
Data correspond to usage on the plateform after 2015. The current usage metrics is available 48-96 hours after online publication and is updated daily on week days.
Initial download of the metrics may take a while.