")
")
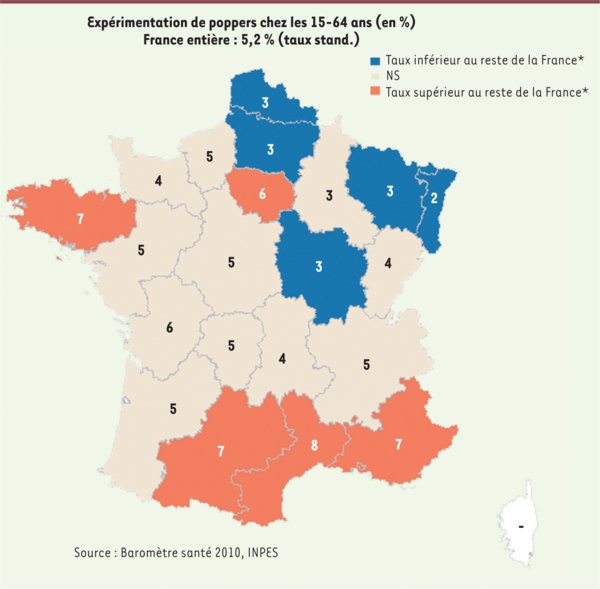
Figure 2.
Télécharger l'image originale
Carte de répartition des expérimentations au sein des régions françaises. *Différences significatives pour la comparaison des taux standardisés (stand.) utilisant la loi normale. Chaque région est comparée au reste de la France. Standardisation directe sur la structure croisée par sexe et âge de la population nationale.
Current usage metrics show cumulative count of Article Views (full-text article views including HTML views, PDF and ePub downloads, according to the available data) and Abstracts Views on Vision4Press platform.
Data correspond to usage on the plateform after 2015. The current usage metrics is available 48-96 hours after online publication and is updated daily on week days.
Initial download of the metrics may take a while.