")
")
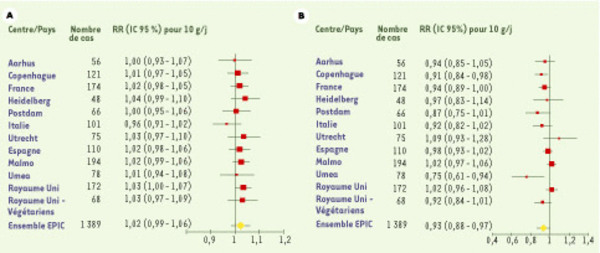
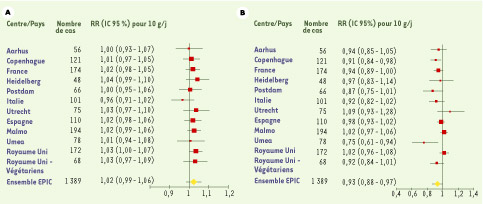
Figure 1.
Télécharger l'image originale
Risque relatif (RR) multivarié et intervalle de confiance (IC) à 95 % par centre EPIC pour une augmentation de consommation de 10 g/j. Le centre des carrés rouges représente l’estimation du RR et la ligne horizontale correspond à l’IC95 %. Le losange jaune correspond à l’estimation pour l’ensemble de EPIC. A. Viande et charcuterie. B. Poisson.
Current usage metrics show cumulative count of Article Views (full-text article views including HTML views, PDF and ePub downloads, according to the available data) and Abstracts Views on Vision4Press platform.
Data correspond to usage on the plateform after 2015. The current usage metrics is available 48-96 hours after online publication and is updated daily on week days.
Initial download of the metrics may take a while.