")
")
Figure 1
Télécharger l'image originale
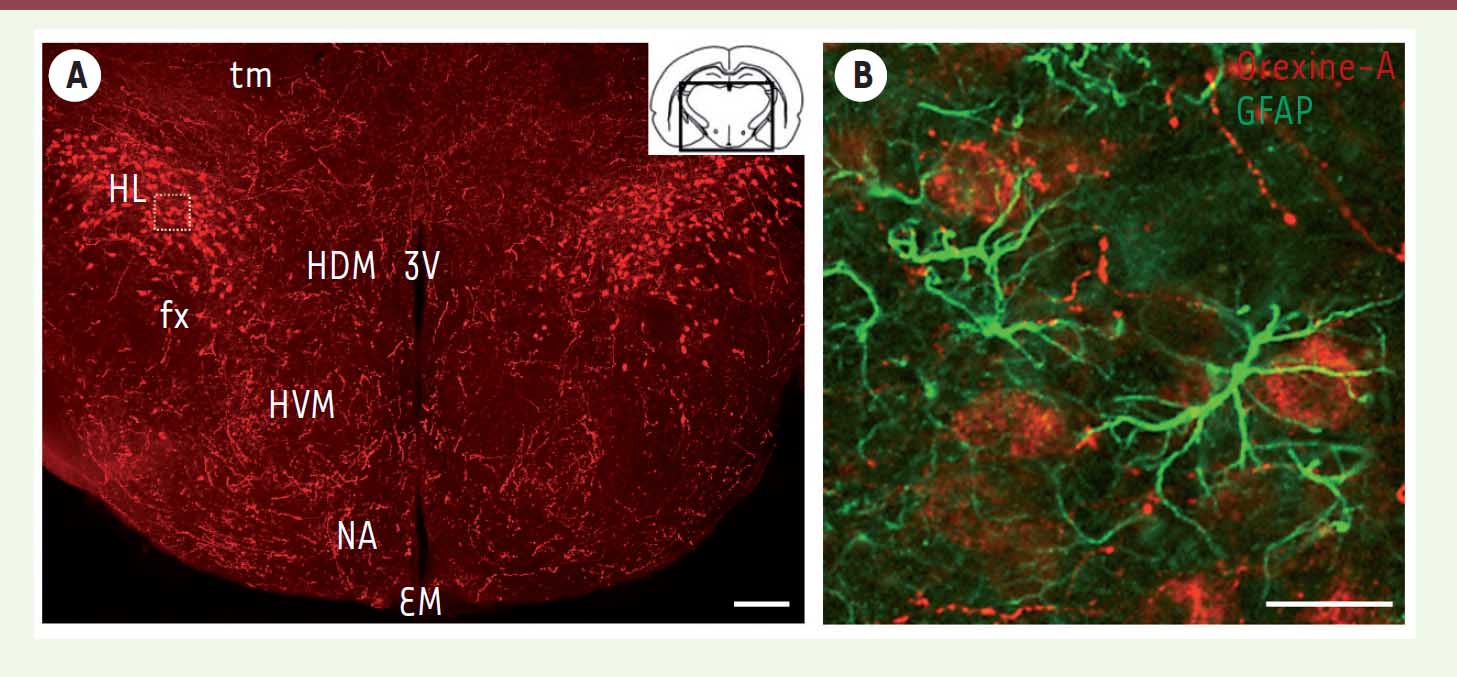
Localisation des neurones à orexine. A. Image en fluorescence, d’une coupe coronale de cerveau de souris passant par l’hypothalamus latéral, prise au microscope confocal et montrant la distribution bilatérale des neurones à orexine (en rouge) positifs pour le neuropeptide orexine-A. Échelle : 200 μm. tm : tractus mamillaire, fx : fornix, 3V : troisième ventricule, EM : éminence médiane, HL : hypothalamus latéral, HDM : hypothalamus dorsomédian, HVM : hypothalamus ventromédian. NA : noyau arqué. B. Grossissement de la zone comprise dans le cadre blanc en (A), montrant les interactions entre les neurones à orexine (en rouge) et les astrocytes (en vert) positifs pour la GFAP (glial fibrillary acidic protein), un marqueur spécifique des astrocytes. Échelle : 25 μm.
Current usage metrics show cumulative count of Article Views (full-text article views including HTML views, PDF and ePub downloads, according to the available data) and Abstracts Views on Vision4Press platform.
Data correspond to usage on the plateform after 2015. The current usage metrics is available 48-96 hours after online publication and is updated daily on week days.
Initial download of the metrics may take a while.