")
")
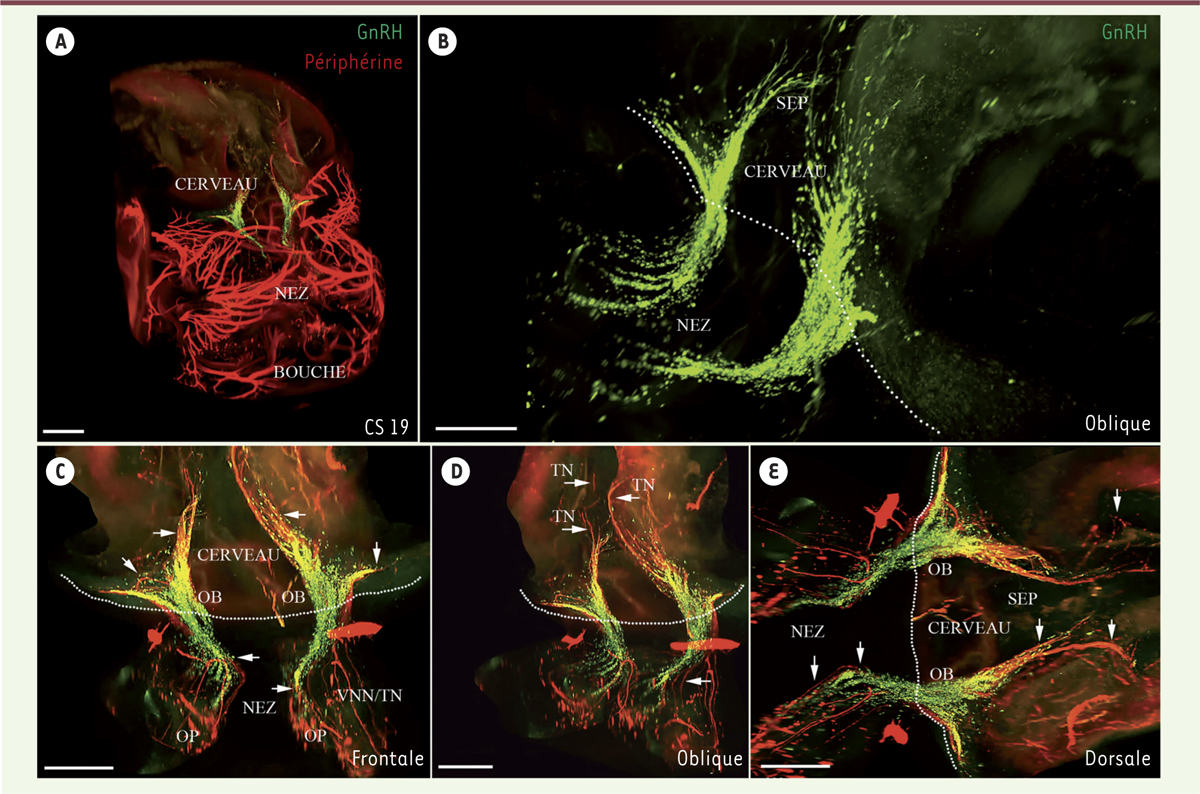
Figure 1.
Télécharger l'image originale
Visualisation en 3D d’un embryon humain préalablement rendu transparent au stade 19 de Carnegie (environ 48e jour du développement embryonnaire). Les différentes vues (A-E) représentent la migration des neurones à GnRH (hormone de libération des gonadotrophines hypophysaires ; immunomarquage en vert) et la matrice de migration (immunomarquage par la périphérine en rouge). OP : placode olfactive ; VNN : nerf voméro-nasal ; TN : nerf terminal ; OB : bulbe olfactif ; SEP : aires septales. Les flèches indiquent les projections du VNN/TN. La ligne de pointillés indique la limite entre le nez et le cerveau. Échelles : A, 800 µm ; B, 200 µm ; C-E, 300 µm (© publié avec autorisation de Development (Cambridge, England) [3]).
Current usage metrics show cumulative count of Article Views (full-text article views including HTML views, PDF and ePub downloads, according to the available data) and Abstracts Views on Vision4Press platform.
Data correspond to usage on the plateform after 2015. The current usage metrics is available 48-96 hours after online publication and is updated daily on week days.
Initial download of the metrics may take a while.