")
")
Free Access
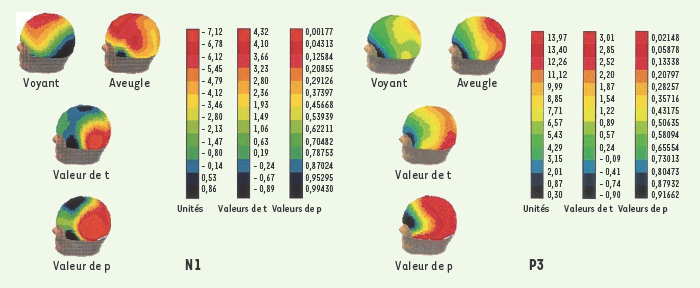
Figure 2.

Télécharger l'image originale
Distribution des composantes N1 (portion gauche de la figure) et P3 (portion droite de la figure) chez les personnes aveugles et voyantes durant une tâche de localisation sonore. Les couleurs rouge-orange correspondent aux régions les plus activées et les couleurs bleu-noir aux régions les moins activées (adaptée de [6]).
Current usage metrics show cumulative count of Article Views (full-text article views including HTML views, PDF and ePub downloads, according to the available data) and Abstracts Views on Vision4Press platform.
Data correspond to usage on the plateform after 2015. The current usage metrics is available 48-96 hours after online publication and is updated daily on week days.
Initial download of the metrics may take a while.