")
")
Free Access
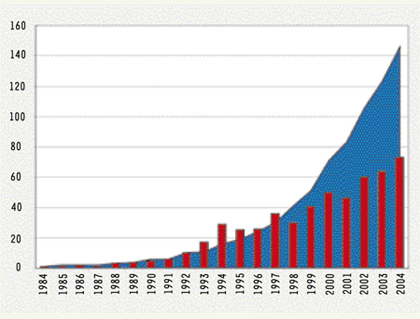
Figure 1.

Télécharger l'image originale
Évolution de l’activité en ADN ancien en vingt ans (1984-2004). Histogrammes : nombre de publications en ADN ancien par an ; courbe : nombre cumulatif d’espèces soumises à des études d’ADN ancien.
Current usage metrics show cumulative count of Article Views (full-text article views including HTML views, PDF and ePub downloads, according to the available data) and Abstracts Views on Vision4Press platform.
Data correspond to usage on the plateform after 2015. The current usage metrics is available 48-96 hours after online publication and is updated daily on week days.
Initial download of the metrics may take a while.