")
")
Open Access
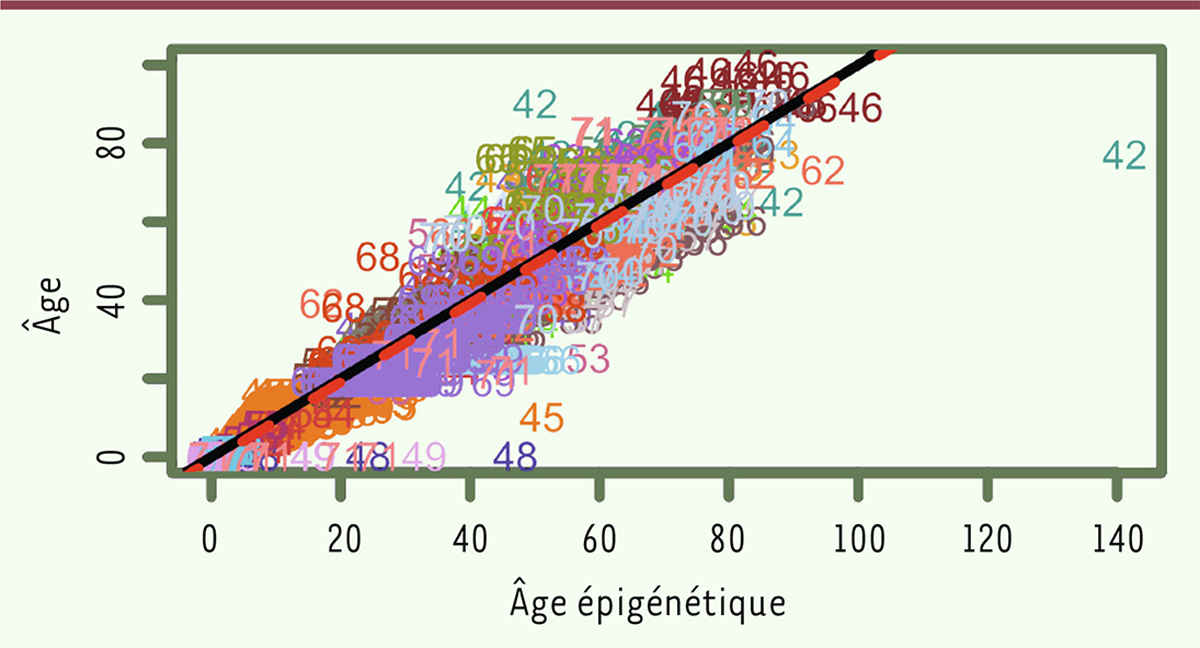
Figure 1.
Télécharger l'image originale
Corrélation existant entre l’âge chronologique (en ordonnée) et l’âge épigénétique ADNm (en abscisse), déterminée d’après la méthylation des paires CpG. Coefficient de régression : 0,96. Les différentes couleurs correspondent à des échantillons de tissus ou de cellules différents (figure adaptée de [2]).
Current usage metrics show cumulative count of Article Views (full-text article views including HTML views, PDF and ePub downloads, according to the available data) and Abstracts Views on Vision4Press platform.
Data correspond to usage on the plateform after 2015. The current usage metrics is available 48-96 hours after online publication and is updated daily on week days.
Initial download of the metrics may take a while.