")
")
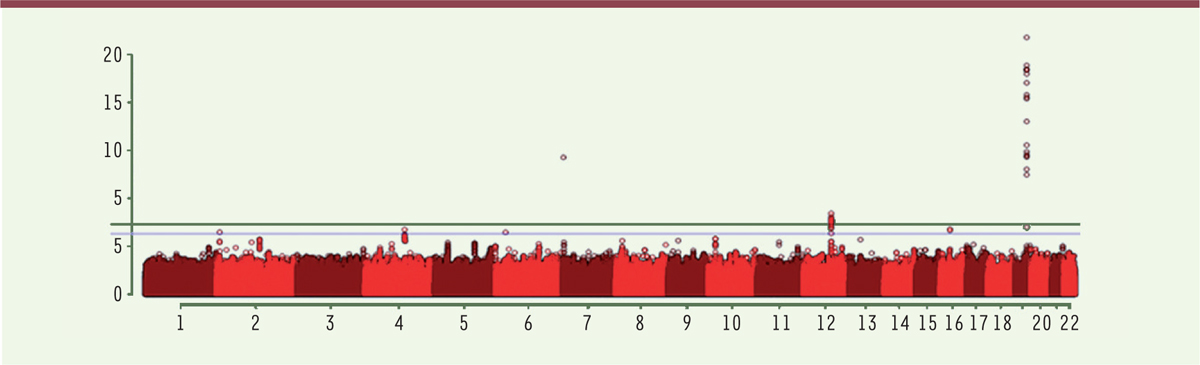
Figure 2.
Télécharger l'image originale
Manhattan plot de l’analyse GWAS pour la longévité extrême. En abscisse, les différents chromosomes, de 1 à 22 (couleurs alternées). En ordonnée, significativité des signaux observés, la ligne inférieure correspond à p = 5 x 10⁻⁷, la supérieure à p = 5 x 10⁻⁸ (limite de significativité « génome entier ») (extrait partiel remanié de la figure 2A de [4]).
Current usage metrics show cumulative count of Article Views (full-text article views including HTML views, PDF and ePub downloads, according to the available data) and Abstracts Views on Vision4Press platform.
Data correspond to usage on the plateform after 2015. The current usage metrics is available 48-96 hours after online publication and is updated daily on week days.
Initial download of the metrics may take a while.