")
")
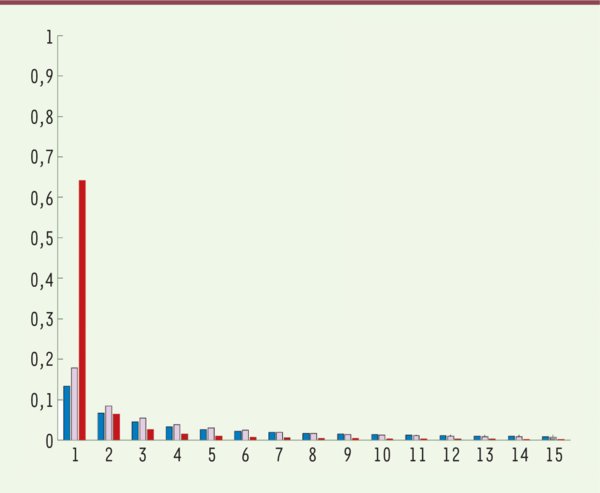
Figure 2.
Télécharger l'image originale
Simulation indiquant la probabilité (en ordonnée) de retrouver l’allèle mineur d’un SNV une, deux, trois ou N fois parmi 500 génomes séquencés (abscisse). Bleu : population constante ; rose : population ayant subi un goulet d’étranglement puis restée constante ; rouge : population ayant cru d’un facteur 1 000 au cours des 400 dernières générations (soit 10 000 ans) (données extraites de la figure 2 de [6]).
Current usage metrics show cumulative count of Article Views (full-text article views including HTML views, PDF and ePub downloads, according to the available data) and Abstracts Views on Vision4Press platform.
Data correspond to usage on the plateform after 2015. The current usage metrics is available 48-96 hours after online publication and is updated daily on week days.
Initial download of the metrics may take a while.