")
")
Free Access
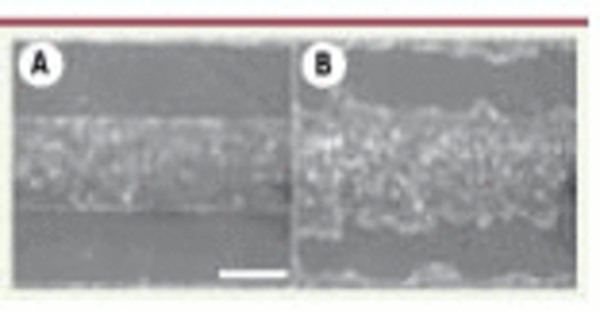
Figure 2.
Télécharger l'image originale
Évolution d’une bande de cellules MDCK. A. t = 90 min. B. t = 12 h. La barre mesure 400 µm. Le temps t=0 est compté à partir du retrait du pochoir (adapté de [3] avec permission © (2007) National Academy of Sciences, USA).
Current usage metrics show cumulative count of Article Views (full-text article views including HTML views, PDF and ePub downloads, according to the available data) and Abstracts Views on Vision4Press platform.
Data correspond to usage on the plateform after 2015. The current usage metrics is available 48-96 hours after online publication and is updated daily on week days.
Initial download of the metrics may take a while.