")
")
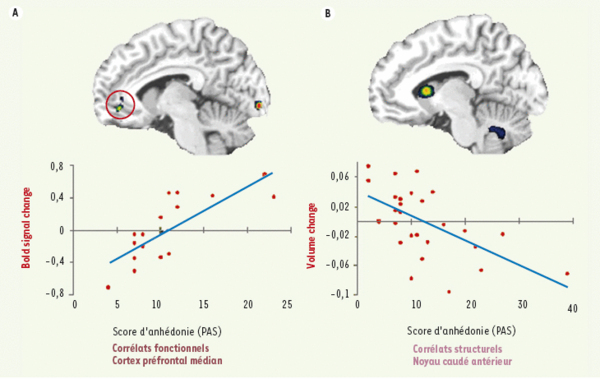
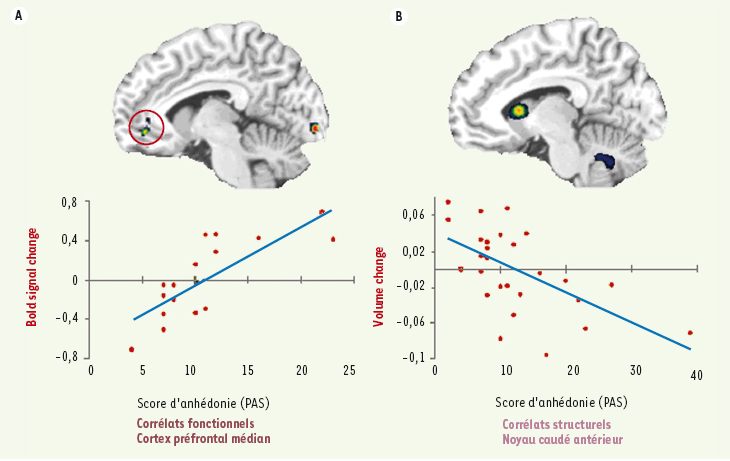
Figure 1.
Télécharger l'image originale
A. Corrélation positive entre l’activité cérébrale du cortex préfrontal médian (signal BOLD - l’axe y) et le score d’anhédonie (Échelle PAS - l’axe x) durant le traitement de l’information hédonique. B. Résumé du résultat principal de l’analyse morphométrique par voxels (optimized VBM) en montrant la corrélation négative entre le volume du noyau caudé antérieur et le score d’anhédonie.
Current usage metrics show cumulative count of Article Views (full-text article views including HTML views, PDF and ePub downloads, according to the available data) and Abstracts Views on Vision4Press platform.
Data correspond to usage on the plateform after 2015. The current usage metrics is available 48-96 hours after online publication and is updated daily on week days.
Initial download of the metrics may take a while.