")
")
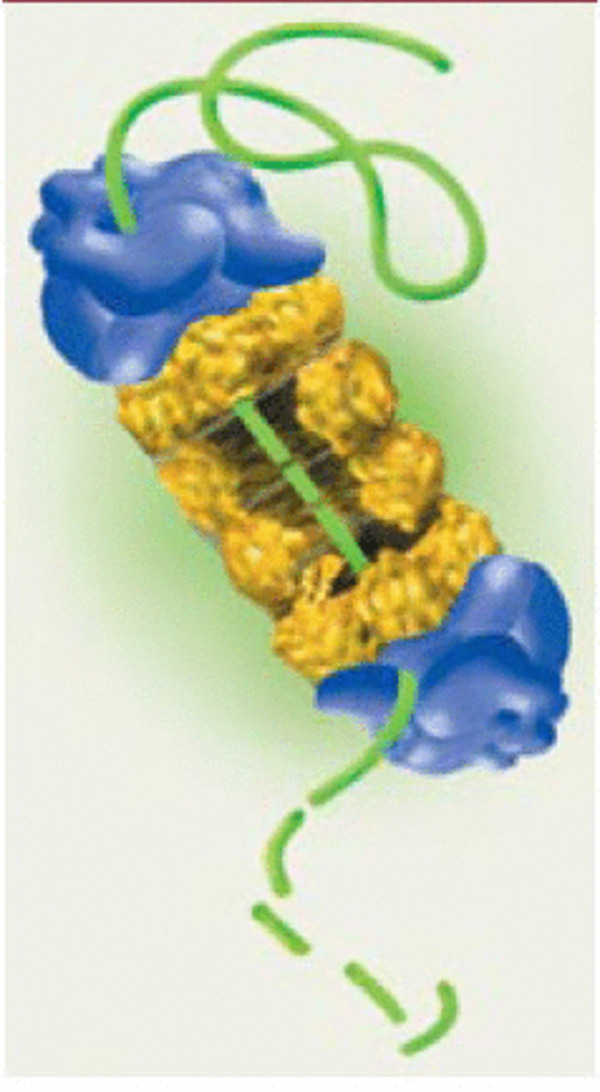
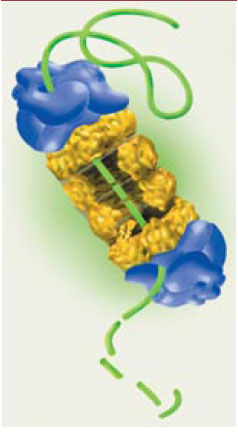
Figure 1.
Télécharger l'image originale
Représentation schématique de l’organisation du protéasome. En bleu, les deux sous-unités 19S; en jaune, le complexe central 20S. La protéine intacte est figurée par un trait vert continu, et la protéine dégradée par une trait vert discontinu. (avec l’autorisation de l’US Department of Energy Human Genome Program or US Department of Energy Genomes to Life Program et tiré du site http://www.ornl.gov/hgmis).
Current usage metrics show cumulative count of Article Views (full-text article views including HTML views, PDF and ePub downloads, according to the available data) and Abstracts Views on Vision4Press platform.
Data correspond to usage on the plateform after 2015. The current usage metrics is available 48-96 hours after online publication and is updated daily on week days.
Initial download of the metrics may take a while.